EYFS Attainment 2015-16
Measurement & Tracking:
• Initial baseline using Development Matters, Derbyshire Small Stepped Profile and PIVATS.
• Routes For Learning used as appropriate.
• Continued baseline tracking via banding and Points/ steps achieved on Derbyshire
• Tentative P-levels assessed at end of year for each child.
• Termly tracking is used to evaluate progress and identify interventions where necessary.
EYFS: Overview:
• 0% of pupils are working at ‘age expected’ bandings.
• 100 % of pupils made progress based on assessments using Derbyshire Small Stepped Profile/Development Matters.
• 100% of pupils in the EYFS met end of year ‘banding’ targets.
• 100% of pupils in the EYFS made progress in the area of PSED.
• 100% of pupils in the EYFS made progress in the area of C&L.
• 100% of pupils in the EYFS made progress in the area of PD.
• The average amount of progress points made in the area of PSED is 13 per pupil (Derbyshire Small Stepped Profile).
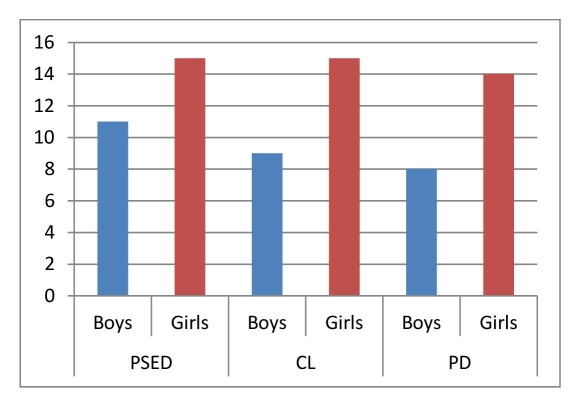
Average number of points moved per area of learning- Boys vs Girls:
CL
PD
Boys
Girls
Boys
Girls
Boys
Girls
11
15
9
15
8
14
Gender:
CL
PD
PP
Not PP
PP
Not PP
PP
Not PP
14
7
16
8
14
7
Pupil Premium vs Non Pupil Premium:
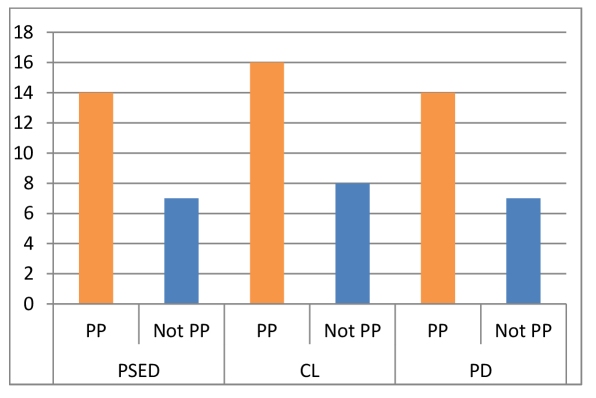
CL
PD
ASD
Not ASD
ASD
Not ASD
ASD
Not ASD
23
9
11
8
17
13
ASD & Non ASD:
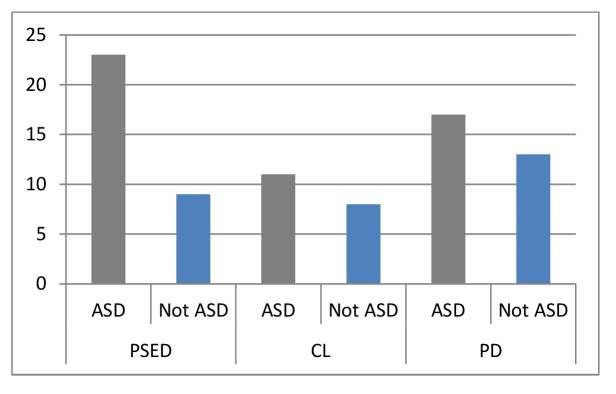
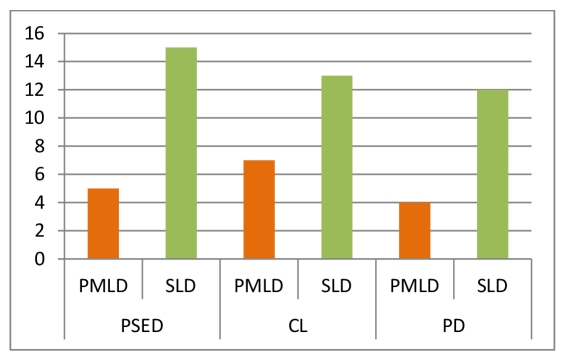
CL
PD
PMLD
SLD
PMLD
SLD
PMLD
SLD
5
15
7
13
4
12
PMLD & SLD Pupils :
Overview based on PIVATS 4 Assessment supported by Routes For Learning (Reception Children):
*Note-All of these children are generally working in the Prime areas.
• 100% pupils made progress in all PIVATS areas.
• 37.5% pupils made accelerated progress in ALL areas.
• 62.5% pupils made accelerated progress in at least one assessed PIVATS area.
• Overall pupils made an average of 1.1 (P-Scale) levels of progress across assessed PIVATS Area’s.
• Girls averaged 1.5 (P-Scale) levels of progress across assessed PIVATS Area’s.
• Boys averaged 0.8 (P-Scale) levels of progress across assessed PIVATS Area’s.
• Non PMLD children averaged 1.25 (P-Scale) levels of progress across assessed PIVATS Area’s.
Targets:
• 50% of pupils exceeded their targets in ALL PIVATS areas .
• 75% of pupils exceeded their targets in more than one assessed PIVATS area.
• 50% of pupils made Upper Quartile rate progress when compared to a translated version of the Key Stage 1 2011 Progression Guidance.
• 75% of pupils made Median or Upper Quartile rate progress when compared to a translated version of the Key Stage 1 2011 Progression Guidance.
Levels of Progress (by Subject Area):
*Note-All of these children are generally working in the Prime areas.
In English Boys on average made 0.8 levels of progress and girls made 1.6.For PMLD pupils this was 0.7 and for ASD pupils 1.3.
In Maths Boys on average made 0.9 levels of progress and girls made 1.3.For PMLD pupils this was 0.6 and for ASD pupils 1.1.
In Science Boys on average made 0.8 levels of progress and girls made 1.35.For PMLD pupils this was 0.4 and for ASD pupils 1.
In PSED Boys on average made 0.75 levels of progress and girls made 1.6.For PMLD pupils this was 1.4 and for ASD pupils 1.6.
In ICT Boys on average made 0.85 levels of progress and girls made 1.7.For PMLD pupils this was 0.2 and for ASD pupils 1.3.